This is a simple tutorial about displaying report (using Microsoft Reporting) in VB.NET
One of many questions I often encounter is 'how to display a report' in an application. Most of the time, the people asking that question mentions a specific product, which is Crystal Reports. But in reality there are many products that can be used to display a report in your program, such as Crystal Reports (bundled in Visual Studio .NET, up until version 2008), Xtra Reports, Active Reports, and many more.
This time I will show you how to use Microsoft's own reporting Technology, which is Microsoft Reporting, which is included in Visual Studio ( From version 2005 - CMIIW), and very similar (a lighter version) of the more famous "Microsoft SQL Server Reporting Services".
In my personal opinion, if you are planning to create a report that will be exported to Microsoft Excel, it's alot easier to make it using Microsoft Reports instead of Crystal Reports. Mainly because if you're using Microsoft Reports, even the design layout is shaped in cells, as opposed to free placement layout of Crystal Reports, therefore you have more control on how the report would appear in the exported excel document.
Okay, let's begin.
The first thing we need to do is to create some sample data for our report. Start your SQL Server/SQL Server Express and Create a new database. Call it "StudentsDB",
and create a new table named "Students" using this script :
 Create Table Students
 (
      StudentID             char(5)
      ,StudentName          varchar(50)
      ,BirthDate            datetime
      ,Gender               varchar(6)
 );
* Or alternatively you could always use the Table Designer.
Let's insert some sample data, use this script or you can enter them manually.
 Insert Into Students(StudentID,StudentName,BirthDate,Gender)
 Values ('S0001','Astrid','1986-05-20','Female')
 Insert Into Students(StudentID,StudentName,BirthDate,Gender)
 Values ('S0002','Betty','1989-03-10','Female')
 Insert Into Students(StudentID,StudentName,BirthDate,Gender)
 Values ('S0003','Cindy','1987-06-21','Female')
 Insert Into Students(StudentID,StudentName,BirthDate,Gender)
 Values ('S0004','Donald','2000-01-01','Male')
 Insert Into Students(StudentID,StudentName,BirthDate,Gender)
 Values ('S0005','Eric','1982-08-27','Male')
Okay, now that we're done, let's boot up Visual Studio (or Visual Studio Express). We're going to try to load that data inside a Gridview to make sure we're able to connect to database.
1. Create a New Project, with the type Windows Forms Application, name it "StudentsProject". Visual Studio will create it using the default template for windows applications, and automatically an empty form called Form1
2. Pull a DataGridView from the toolbox onto Form1, name it 'dgvStudents'
3. Pull a button from the ToolBox onto Form1, name it 'btnLoad', give it the text "Load"

4. Go to the click event handler for button Load. put this code inside. Don't forget to add an import for System.Data.SQLClient at the top most of the file. Adjust your connection information according to your own configuration.
     Dim ServerName As String = ".\SQLExpress"
     Dim DatabaseName As String = "dbStudents"
     Dim UserID As String = "sa"
     Dim Password As String = "abc@123"
     Dim Conn As New SqlConnection _
     ("Data Source=" & ServerName & ";Initial Catalog=" & DatabaseName & ";user id=" & UserID & ";password=" & Password)
     Dim dt As New DataTable
     Dim da As New SqlDataAdapter("Select StudentID,StudentName,BirthDate,Gender From Students", Conn)
     da.Fill(dt)
     dgvStudents.DataSource = dt

5. Try to run the program, if everything checks out, you should see data loading to the DatagridView when you click 'Load'

6. Click on the Project name at the Solution Explorer, choose Add New Item, on the Dialog that appeared, choose 'Dataset' (in Visual Studio 2008, it should be categorized under 'Data'). Leave the dataset name as DataSet1
7. DataSet1 is automatically opened in Visual Studio, it's currently empty and you can see the writing that says so. Right click anywhere on it and pick Add->DataTable

8. Name the datatable as Students, right click to add new column, add all column from the table students, don't forget to change the datatype of BirthDate column into System.DateTime

9. Click on the Project Name at the Solution Explorer, choose Add New Item, on the Dialog that appeared, choose "Report" (In Visual Studio 2008, it should be categorized under "Report"). Make sure that you get the correct item type by checking the file extension, it should be .rdlc. Name it RptStudents.rdlc

10. The Report Designer should appear. In the left side, DataSource window should also appear, with DataSet1 and Students datatable that we already created on Step 7 & 8
11. Drag a Table component from the Toolbox to our report. The table component is a component that shows tabular data. Besides the table component there's also a List component to show data in list form, and Matrix to show crosstabbed data.

12. Drag all column from Students DataTable (from the DataSources Window) to the table. You might need to add another column to the table, do that by clicking on one of the column and choose Add column to the left/right.
Notice that after we put those columns, you can look at the Properties Window for our table ("table1"), and see that the property DatasetName is filled with "DataSet1_Students".

13. Add an additional column to the right, we're going to use it for the student's age. The data that was provided is his/her birthdate, so we need to do some calculation here. We're just gonna use the DateDiff function, compared to Today.
* Note : If the program had a database located on another computer,it's a bad idea if you calculate It in the client side, because Today() is going to be calculated from the client's computer (where you install your software), a better idea might be from the SQL Query, compared to GetDate() which is according to the database server.
Right Click on the detail part where we'll put the age column, choose expression. A dialog would appear.

14. Type the Formula =DateDiff(DateInterval.Year,Fields!BirthDate.Value,Today())
You can also use the hints provided by visual studio on the bottom part of the Dialog. Like for example you can find DateDiff and Today by clicking on Common Functions -> Date & Time, and you can choose the BirthDate Column from the Category Fields(DataSet1_Students)

15. Add another column to the table, this time to the left. In the details, right click and choose expression again, this time fill it with =RowNumber("table1") . This will show the record number, with table1 as the scope (table1 is the name of our table)

16. Add some borders to the table, select all column & rows inside the table and click on the border icon in the toolbar above. Choose all borders

17. One last thing, we should format the BirthDate column to shortdate format, click on the birthdate column, and on the property window, fill the Format property with dd-MMM-yyyy

Okay, now to show the report, we need to use "ReportViewer" component, we'll put it in another form to make things more tidy.
18. Right click on the project name at the solution explorer. Choose Add->Windows Form, Leave the name as Form2. Set the property WindowState as Maximized, so that the form is shown in maximized state.
19. Drag a MicrosoftReportViewer component from the ToolBox onto Form2, set the Dock property to Fill so that it fills up the form

20. Go to the design view of Form1, Drag a button from the toolbox, name it btnShowReport, give it the text "Show Report"
21. Go to the click event handler for button btnShowReport, put this code inside. Before that, you need to add an Import for the Microsoft.Reporting.Winforms namespace in the topmost of the file.
Imports Microsoft.Reporting.WinForms
inside the event handler :
     Dim ServerName As String = ".\SQLExpress"
     Dim DatabaseName As String = "dbStudents"
     Dim UserID As String = "sa"
     Dim Password As String = "abc@123"
     Dim Conn As New SqlConnection _
     ("Data Source=" & ServerName & ";Initial Catalog=" & DatabaseName & ";user id=" & UserID & ";password=" & Password)
     Dim dt As New DataTable
     Dim da As New SqlDataAdapter("Select StudentID,StudentName,BirthDate,Gender From Students", Conn)
     da.Fill(dt)

     Dim DataSetName As String = "DataSet1"
     Dim DataTableName As String = "Students"
     Dim rds As New ReportDataSource(DataSetName & "_" & DataTableName, dt)

     Dim ReportViewerForm As New Form2
     ReportViewerForm.ReportViewer1.LocalReport.ReportEmbeddedResource = My.Application.Info.AssemblyName & ".RptStudents.rdlc"
     ReportViewerForm.ReportViewer1.LocalReport.DataSources.Add(rds)
     ReportViewerForm.ReportViewer1.RefreshReport()
     ReportViewerForm.Show()
Explanation
a. This part is just creating a connection to the sql server, and fill a datatable using a datadapter
     Dim ServerName As String = ".\SQLExpress"
     Dim DatabaseName As String = "dbStudents"
     Dim UserID As String = "sa"
     Dim Password As String = "abc@123"
     Dim Conn As New SqlConnection _
     ("Data Source=" & ServerName & ";Initial Catalog=" & DatabaseName & ";user id=" & UserID & ";password=" & Password)
     Dim dt As New DataTable
     Dim da As New SqlDataAdapter("Select StudentID,StudentName,BirthDate,Gender From Students", Conn)
     da.Fill(dt)
b. If you remember (if you don't, see step 12), the report expects "DataSet1_Students", and that's what we're making now : we create as ReportDataSource object with the name DataSet1_Students, and datatable dt for the contents.
     Dim DataSetName As String = "DataSet1"
     Dim DataTableName As String = "Students"
     Dim rds As New ReportDataSource(DataSetName & "_" & DataTableName, dt)
c.Nothing fancy here, we just instatiate Form2 (the form with the Ms Report Viewer control), and told the reportviewer to load RptStudents.rdlc, and add the datasource we created before. And oh yeah, we're treating RptStudents.rdlc as an embedded resource, which means it must be present inside the project, and build together.
There are other ways to treat rdlc files, I usually don't treat them like that, but instead I would include them with the installation files and have them loaded using ReportViewerForm.ReportViewer1.LocalReport.LoadReportDefinition(stream)
     Dim ReportViewerForm As New Form2
     ReportViewerForm.ReportViewer1.LocalReport.ReportEmbeddedResource = My.Application.Info.AssemblyName & ".RptStudents.rdlc"
     ReportViewerForm.ReportViewer1.LocalReport.DataSources.Add(rds)
     ReportViewerForm.ReportViewer1.RefreshReport()
     ReportViewerForm.Show()
22. Try to run the program, if everything checks out, you would have a report shown to you after you click on the Load Report button.

Actually, I could just end the Tutorial here, but as a bonus, I'm going to show you how to add some grouping and some report parameters.
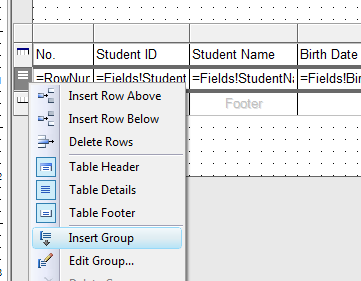
23. Reopen the Report Designer for RptStudents.rdlc, click on the table and the left & top handles would appear. Right click on the left handles, and select Insert Group.
24. On the dialog that appear, select gender as the grouping expression. While you're at it, notice that the group is named "table1_Group1". Click OK to proceed.

25. Notice that now the table had two additional rows, it's the group header and group footer rows.
26. Merge Columns For the group header and group footer, so that it becomes a single column (spans all other column), add these inside the header and footer (as an expression)
Group Header Expression :
=Fields!Gender.Value & " Students"
Group Footer Expression :
="Number Of Students: " & Count(Fields!StudentID.Value,"table1_Group1")

27. Try To run the program again, notice that now the students are grouped by gender. (I remove some border for the picture provided below)

Tips :
- You can change the rownumber so that it repeats from 1 for each group by changing it to =RowNumber("table1_Group1")
- You can make the header repeats for each group by placing them not in the table header but in the group header (just add some group header rows, by right clicking on the existing group headers and choose add row)
28. Now let's add some parameters. Click Report->Report Parameters at the Visual Studio Main Menu
29. On the dialog that appears, Click Add to add a new parameter, name it SampleParameter, and tick the hidden checkbox (because we will fill it by code).

30. Back to the report designer, drag a textbox from the toolbox, inside the textbox fill it with the expression
=Parameters!SampleParameter.Value

31. Go back to click event handler for Button LoadReport. add this code before ReportViewerForm.ReportViewer1.RefreshReport()
     Dim params(0) As ReportParameter
     params(0) = New ReportParameter("SampleParameter", "This is a sample Parameter")
     ReportViewerForm.ReportViewer1.LocalReport.SetParameters(params)

32. Try to run the program, the text "This is a sample Parameter" should appear in the report.
Well, that's all for this Tutorial. Hope it helps. I would write an Indonesian version of this article in another post, hopefully sometime soon.
No comments:
Post a Comment